Bitcoin Leverage Trading India: How Much Leverage is Too Much?
Practical breakdown of safe leverage levels for BTC and ETH futures on Indian exchanges. With a free calculator to see your exact liquidation price.
Most retail crypto traders pick a leverage based on what feels exciting, not what survives. The result: 60-70% of leveraged positions on Indian exchanges get liquidated within 7 days.
This guide gives you the answer in 5 minutes — no theory, just numbers.
The math nobody shows you
A leveraged position liquidates when price moves against you by roughly (100% ÷ leverage) − 0.5% maintenance buffer.
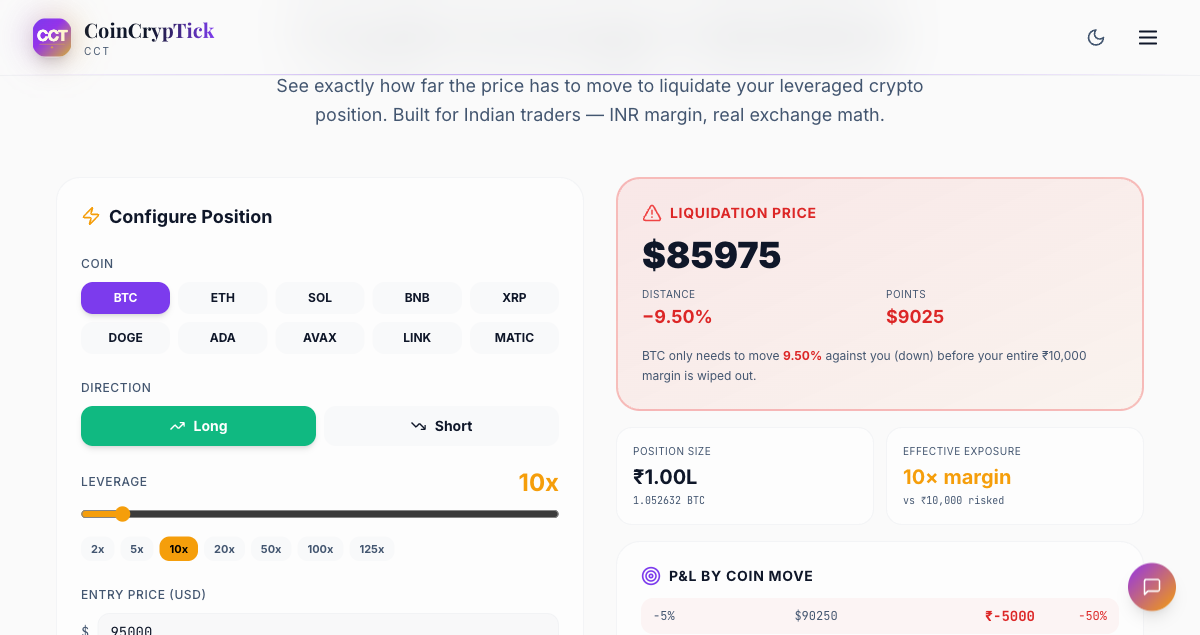
| Leverage | % Move to Liquidation | |---|---| | 2x | 49.5% | | 5x | 19.5% | | 10x | 9.5% | | 25x | 3.5% | | 50x | 1.5% | | 100x | 0.5% | | 125x | 0.3% |
Now compare that to what Bitcoin actually does in normal trading:
- Average 1-hour candle: 0.5-1.5%
- Average 4-hour candle: 1-3%
- Daily wick range: 2-5%
- News-driven minute candle: 0.5-2%
At 100× leverage, the average 1-hour candle can liquidate you. At 50× leverage, a normal 4-hour candle can. Above 25× is statistically a coin flip on any direction trade.
Try it yourself with our free leverage calculator — pick BTC, set 50x, watch how a 1.5% move wipes out your margin.
What pros actually use
After analyzing trades from public Bybit and Binance leaderboards in 2025-26:
- Top 10% of profitable traders: average leverage 3.2x
- Bottom 50%: average leverage 28x
- Worst 10%: average leverage 64x
The pattern is clear. The leverage levels you see promoted on Twitter (50x, 100x) are not what consistently profitable traders use.
Practical leverage rules for Indian traders
- Default to 2-3x for any trade you can't watch every hour. Survives normal volatility, builds account equity steadily.
- Use 5-10x only on confirmed setups with clear stop loss and a target within 24 hours.